Findings

This study examined the response to injury in both sciatic nerves (SN) and dorsal root ganglia (DRG). The nerves were observed after injury, and data were collected at 0, 1, 4, 7, and 14 days. The analysis focused on understanding how neuronal and peripheral tissues respond and heal over time.

Figure 1A: Qunatile-quantile Plot
Quantile-qunatile (QQ) Plot of moderated t-statistics
Representation of theoretical distributions that confirm correct model assumptions.
Figure 1B: Mean-difference (MD) Plot
Mean-differnce Plot  showing log-fold change versus average log expression
14D VS 0D Plot of SN showcasing evenly distributed data points around the zero line y-axis, indicating normalized data.

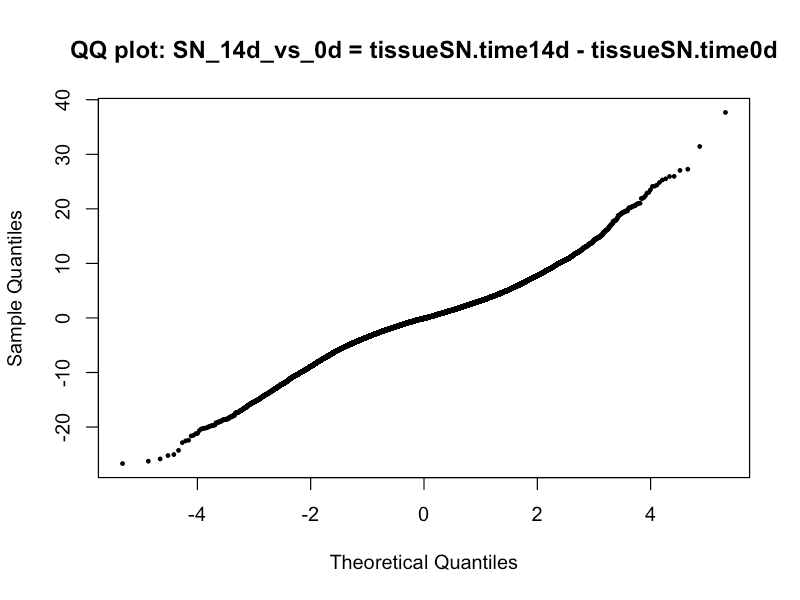
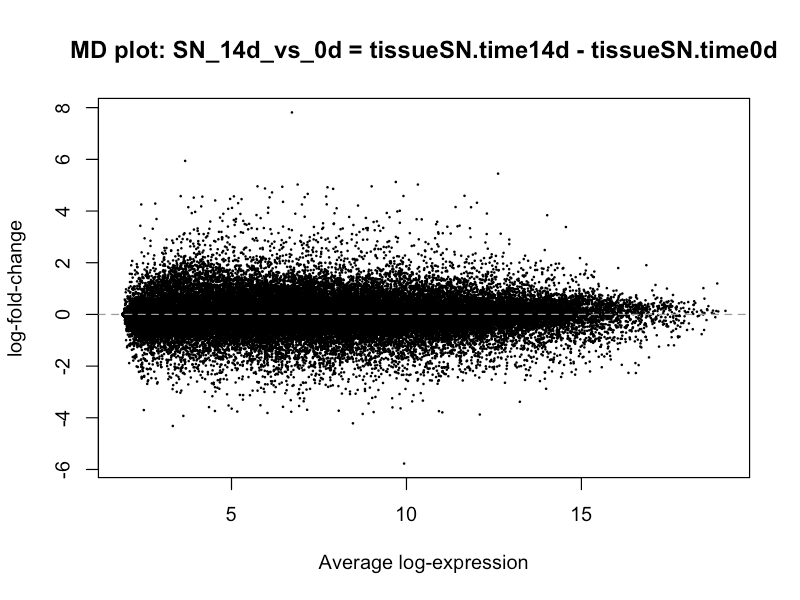
To ensure the data were properly analyzed, mean–difference (MD) plots and QQ plots (Fig. 1A–B), were used. The results confirmed that the data were normalized and statistically significant.

Early response (Day 1)

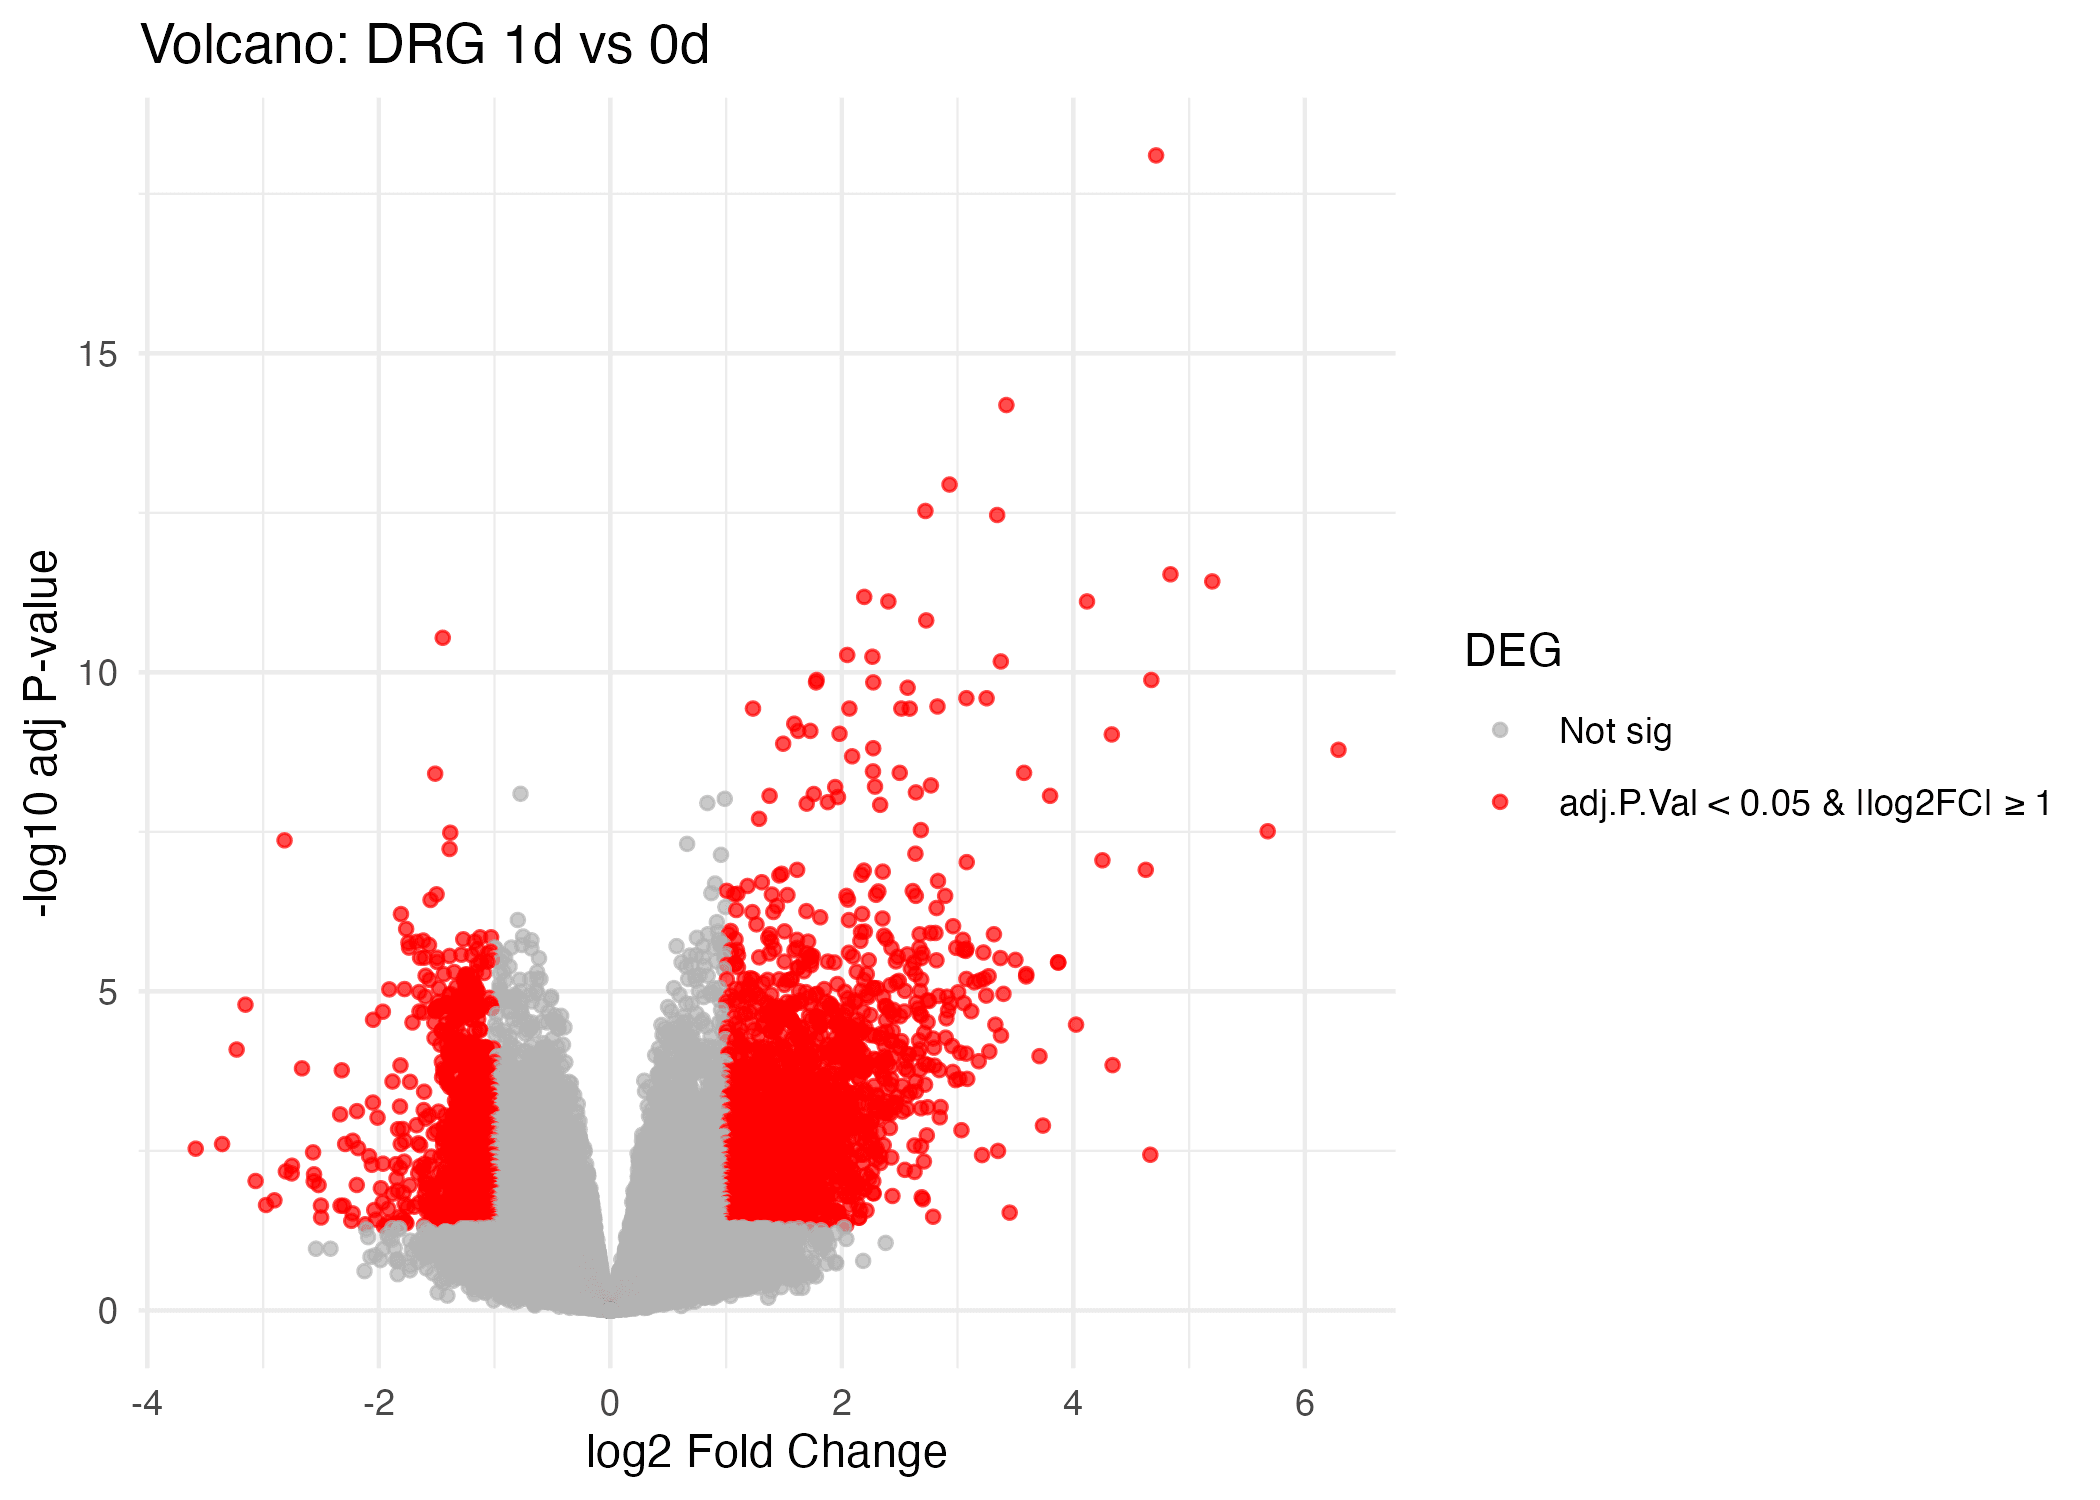
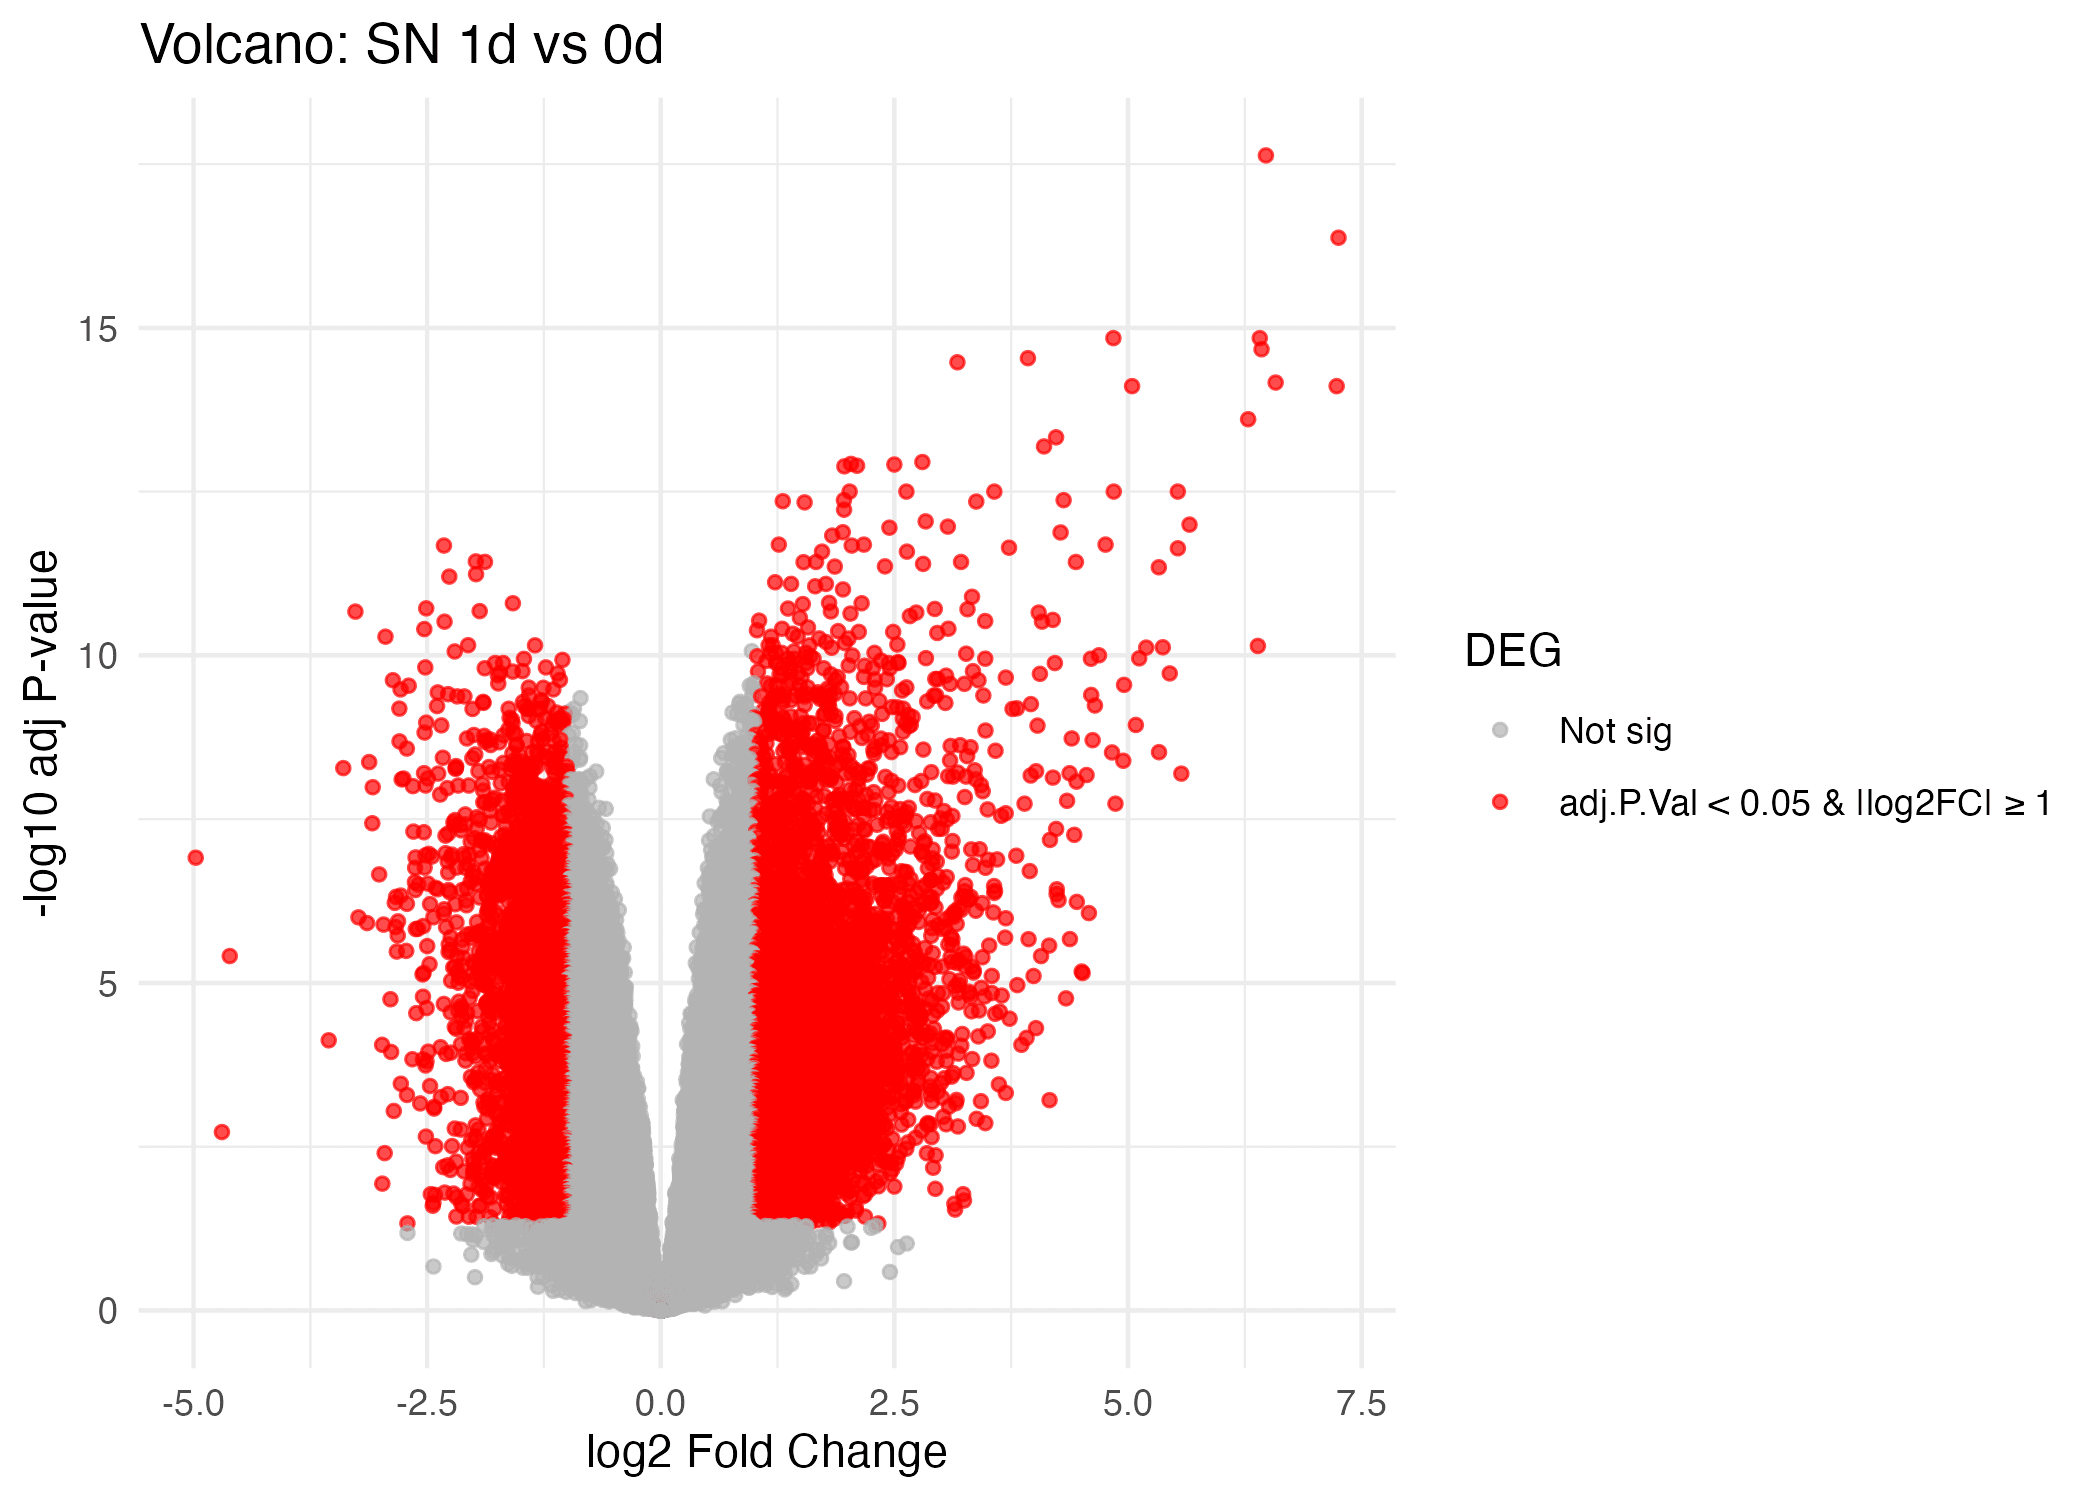
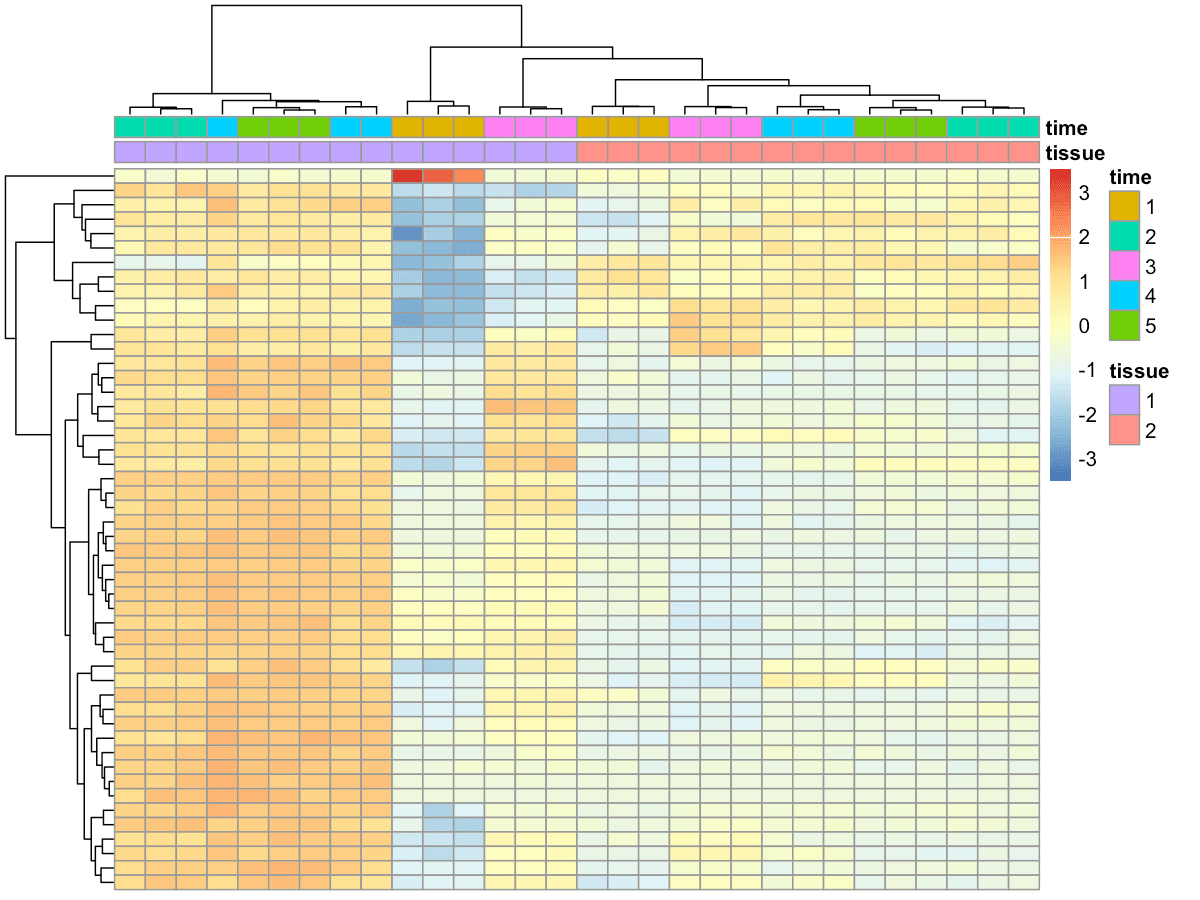
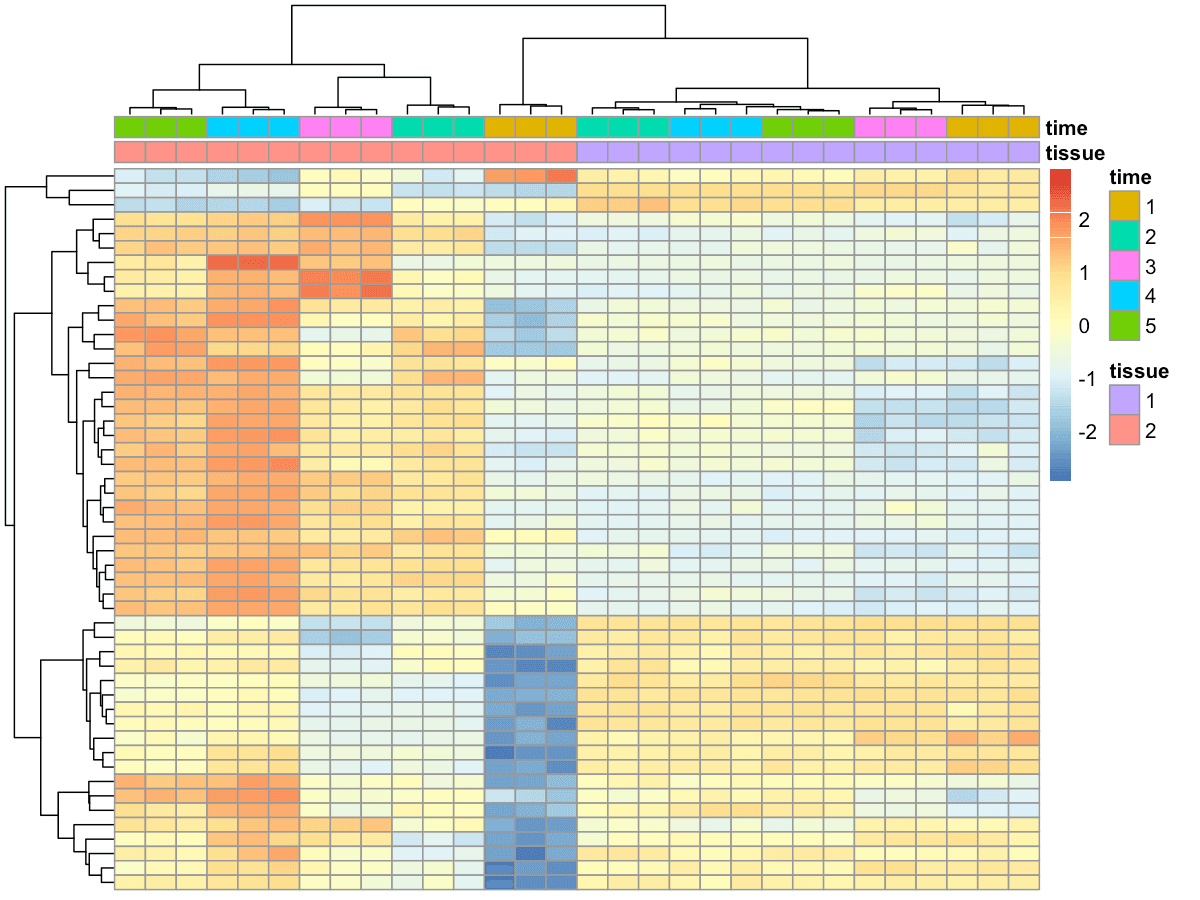
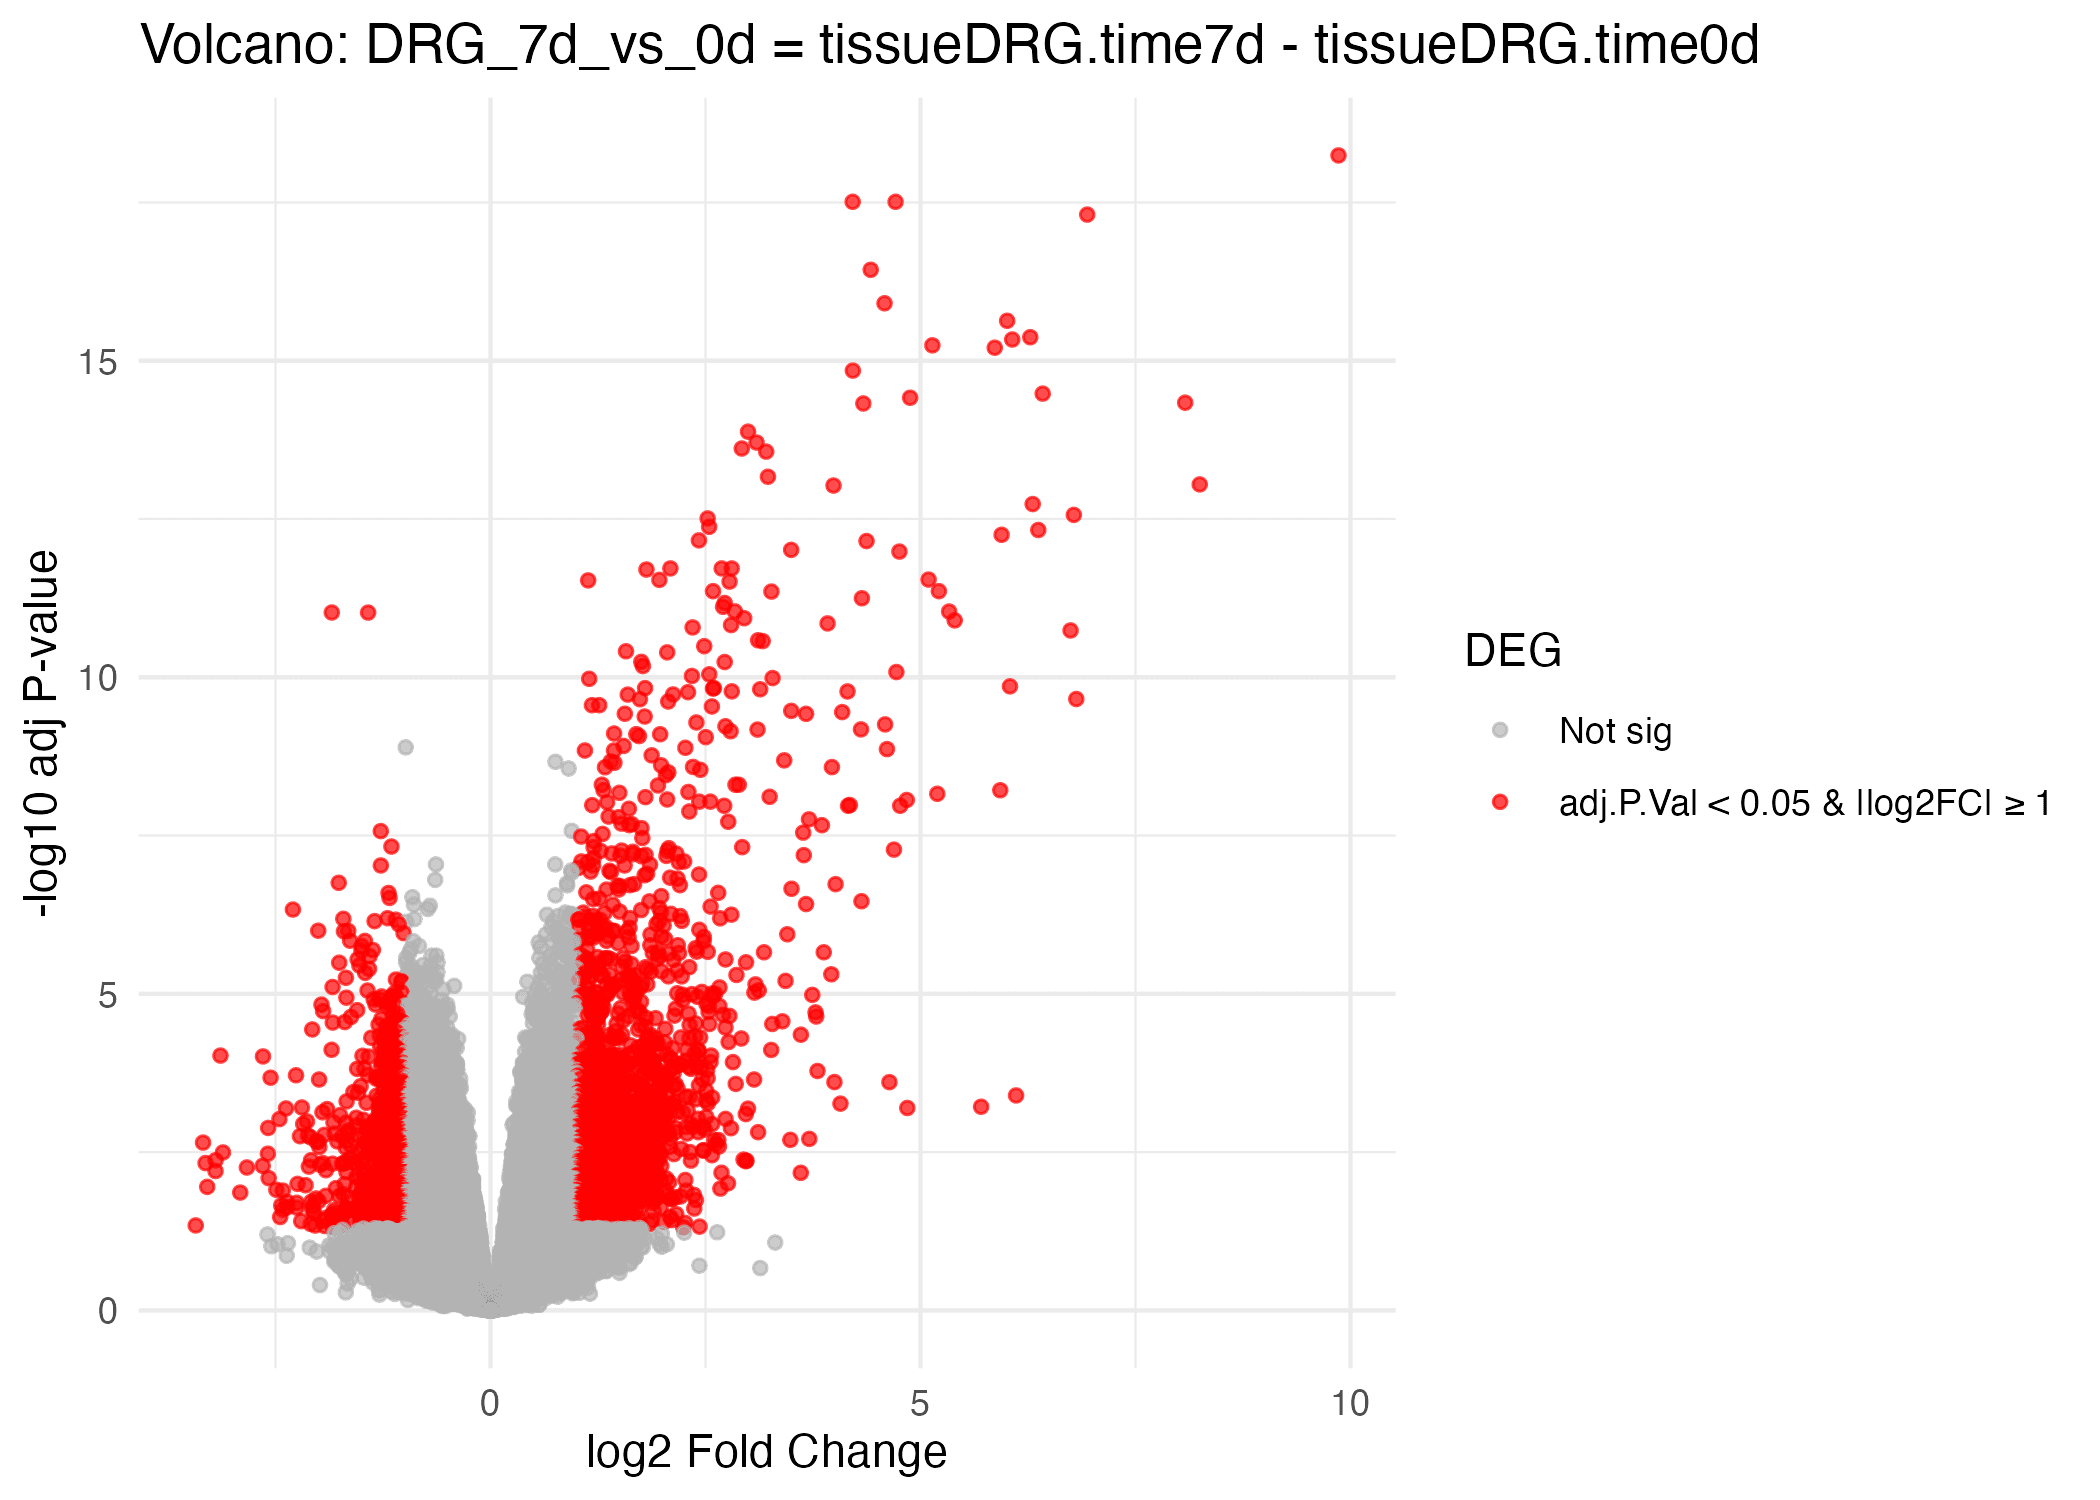
The data shows that at the 1day (1D) timepoint after injury, the DRG nerves were upregulated to a much higher degree than the SN. The heatmaps and volcano plots above (Fig. 2A-D) make the trend evident for the type of nerve respectively. This indicates that DRG neurons are more rapidly deployed to repair damage. SN shows opposite activity and would suggest that the local response and repair mechanisms have not yet activated to provide much healing to the damaged nerves.

Figure 2A: DRG 1d vs 0d — Heatmap (Top 50 genes)
Heatmap of top 50 differentially expressed genes in DRG at 1 day vs 0 day; rows are genes, columns are samples; red indicates upregulation and blue indicates downregulation.
DRG shows an early upregulatiomn and hene activationm at 1 day post-injury.
Figure 2B: SN 1d vs 0d — Heatmap (Top 50 genes)
Heatmap of top 50 differentially expressed genes in SN at 1 day vs 0 day; mostly neutral/blue patterns indicate limited early activation.
SN exhibits minimal early upregulation.
Figure 2C: DRG 1d vs 0d — Volcano plot
Volcano plot for DRG 1 day vs 0 day showing many significant genes with positive log2 fold change; y-axis is -log10 adjusted p-value.
DRG displays extensive significant upregulation at 1 day, indicating rapid neuronal activation after injury.
Figure 2D: SN 1d vs 0d — Volcano plot
Volcano plot for SN 1 day vs 0 day showing fewer significant changes centered near zero; y-axis is -log10 adjusted p-value.
SN shows relatively few significant changes at 1 day, consistent with delayed activation of local immune/repair pathways.

Intermediate response (Days 4–7)

Figure 3A: DRG 4d vs 0d — Heatmap (Top 50 genes)
Heatmap of the top 50 differentially expressed genes in DRG at 4 days vs 0 days. Rows represent genes and columns represent samples, with red indicating upregulation and blue indicating downregulation.
DRG displays moderate gene activation by day 4, suggesting a shift away from the rapid early neuronal response toward stabilization of expression patterns.
Figure 3B: SN 4d vs 0d — Heatmap (Top 50 genes)
Heatmap of the top 50 differentially expressed genes in SN at 4 days vs 0 days. Red indicates upregulation, blue indicates downregulation.
SN begins to show increased upregulation.
Figure 3C: DRG 7d vs 0d — Volcano Plot
Volcano plot for DRG 7 days vs 0 days showing fewer significant upregulated genes compared with the earlier time points, indicating reduced neuronal activation.
DRG shows fewer significantly upregulated genes at day 7.
Figure 3D: SN 7d vs 0d — Volcano Plot
Volcano plot for SN 7 days vs 0 days highlighting widespread upregulation of immune and repair-related genes.
SN exhibits upregulation of immune and cytokine-related genes at day 7.

Moving to the 4-day (4D) time point, activation patterns begin to shift. SN have begun to activate the signaling pathway. This marks the transition to more localized tissue remodeling and less of the early neuronal response seen that the 1D timepoint.

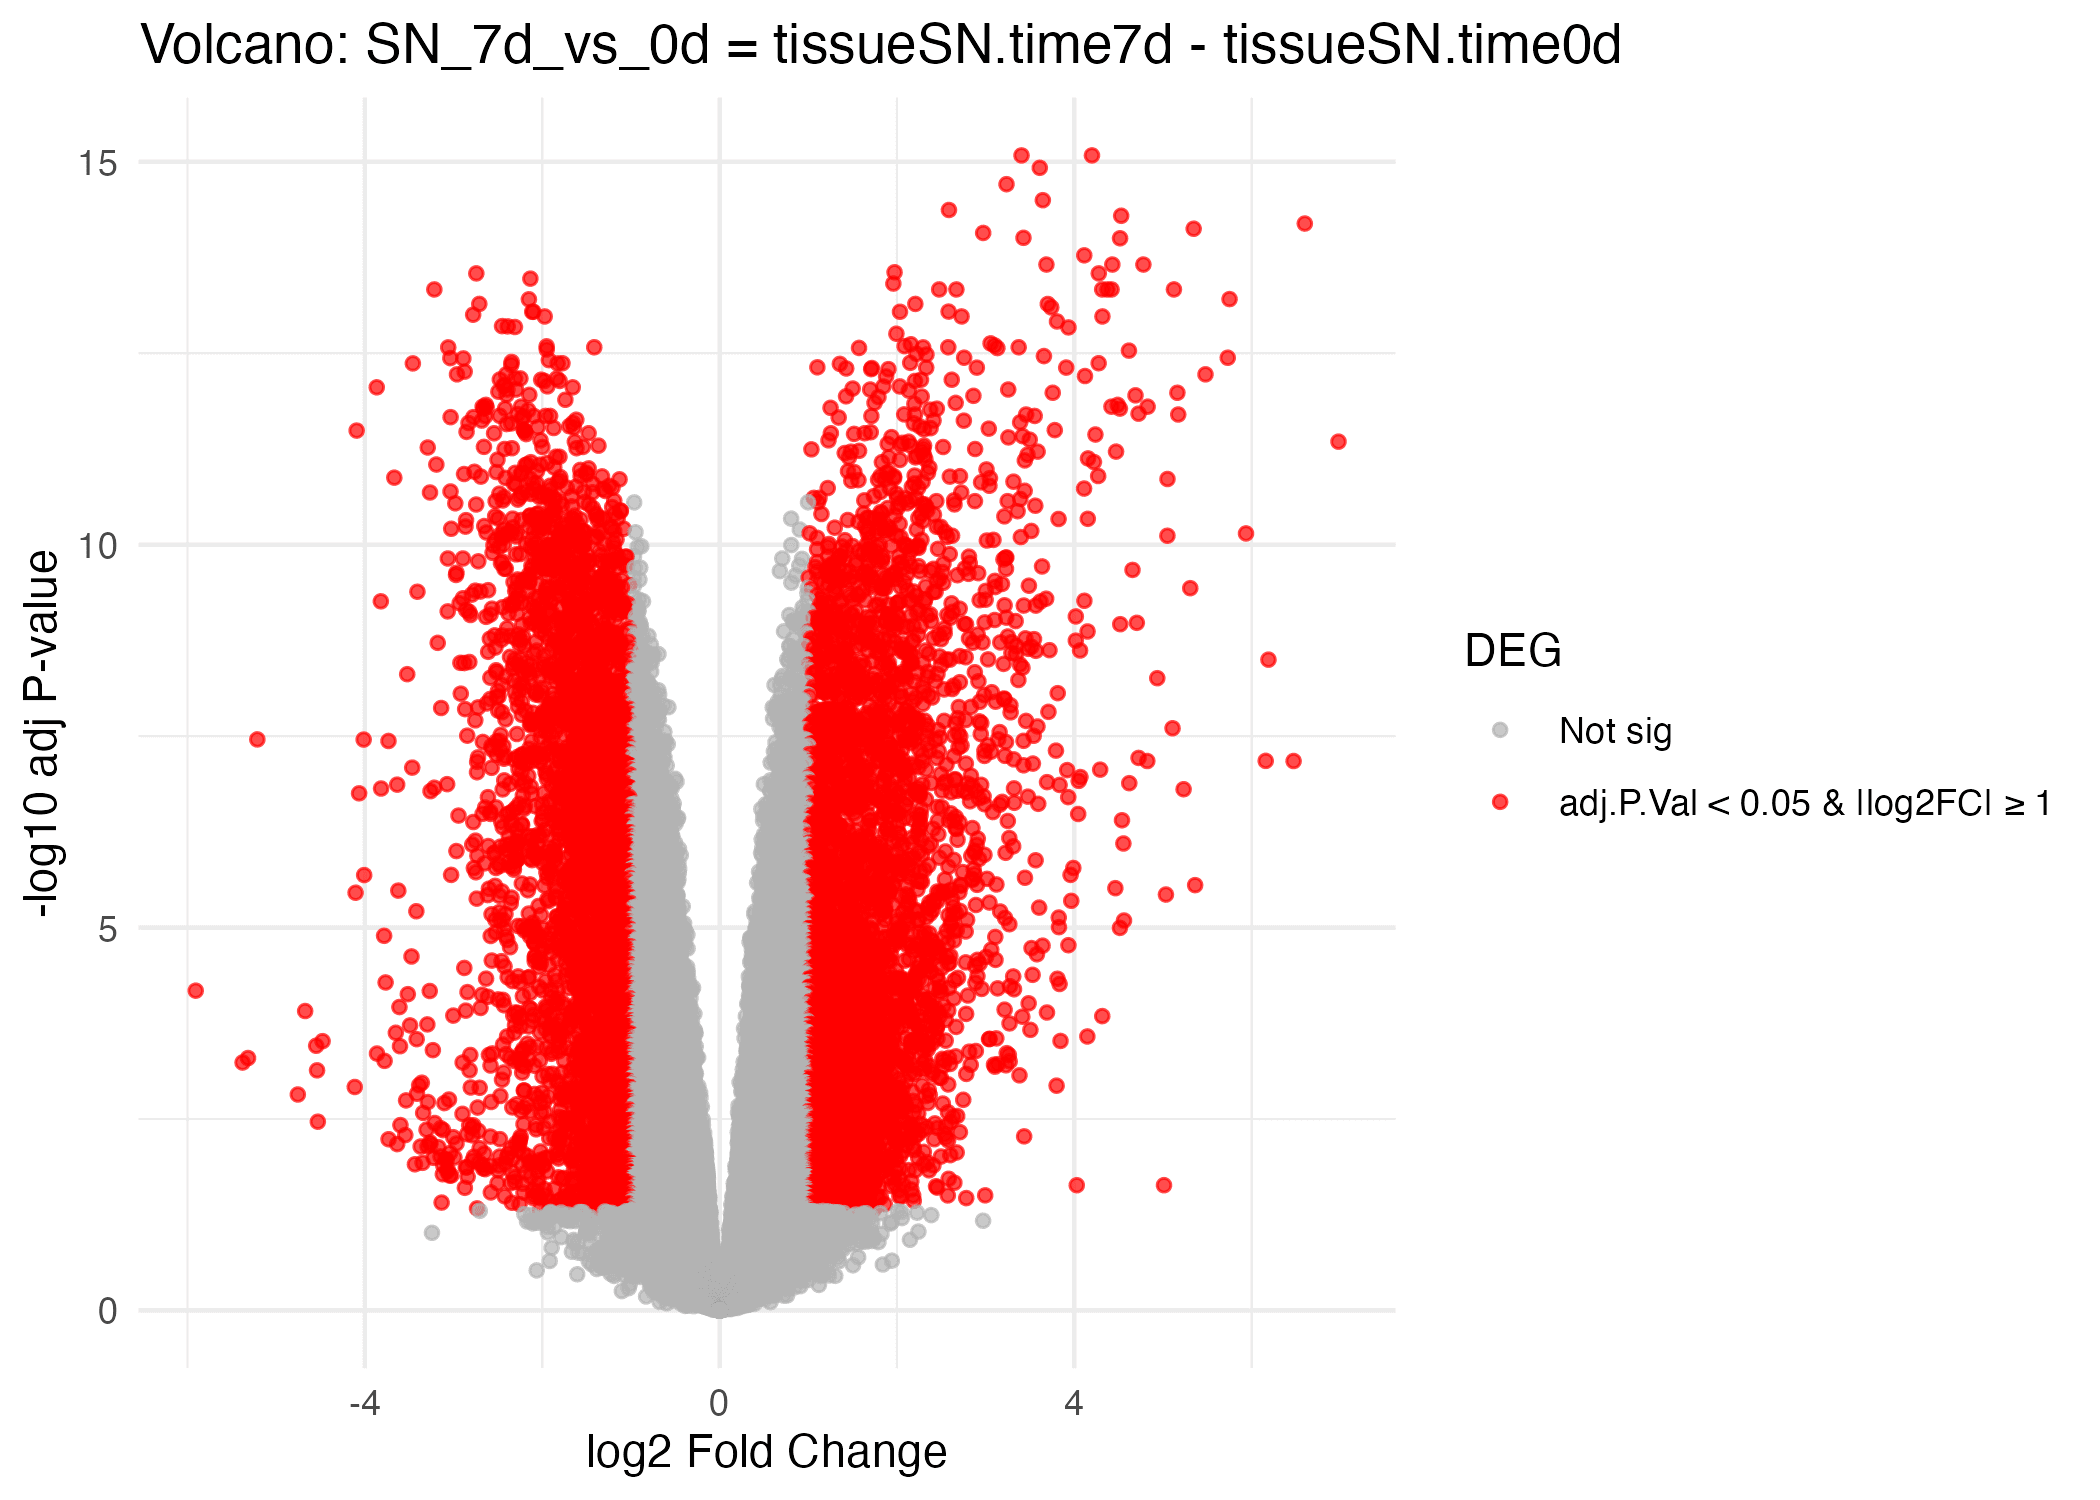
At 7 days (7D), there is an inverse of the trend that was first displayed. SN have exhibited a higher response and the DRG were less upregulated. From this we see that the DRG are much likely to signal strongly when recently injured while SN will have a much slower time to activation which indicate that a different pathway activates the healing response. The SN have become the prominent site of healing and have activated immune and repair pathways to promote regeneration and the DRG have returned to a steady state. Volcano plots and heatmaps for 7 days (Fig. 3A–D) show these shifts from neuronal to immune activation.

Late response (Day 14)

Figure 4A: DRG 14d vs 0d — Heatmap (Top 50 genes)
Heatmap of the top 50 differentially expressed genes in DRG at 14 days vs 0 days. Most genes show expression levels close to baseline, indicating the resolution of neuronal activity.
DRG gene expression at 14 days post-injury is largely normalized to baseline.
Figure 4B: SN 14d vs 0d — Volcano Plot
Volcano plot for SN 14 days vs 0 days showing strong upregulation of immune and regenerative genes; y-axis is −log10 adjusted p-value.
SN maintains broad upregulation of cytokine and repair-related genes at 14 days, demonstrating sustained inflammatory and regenerative signaling.

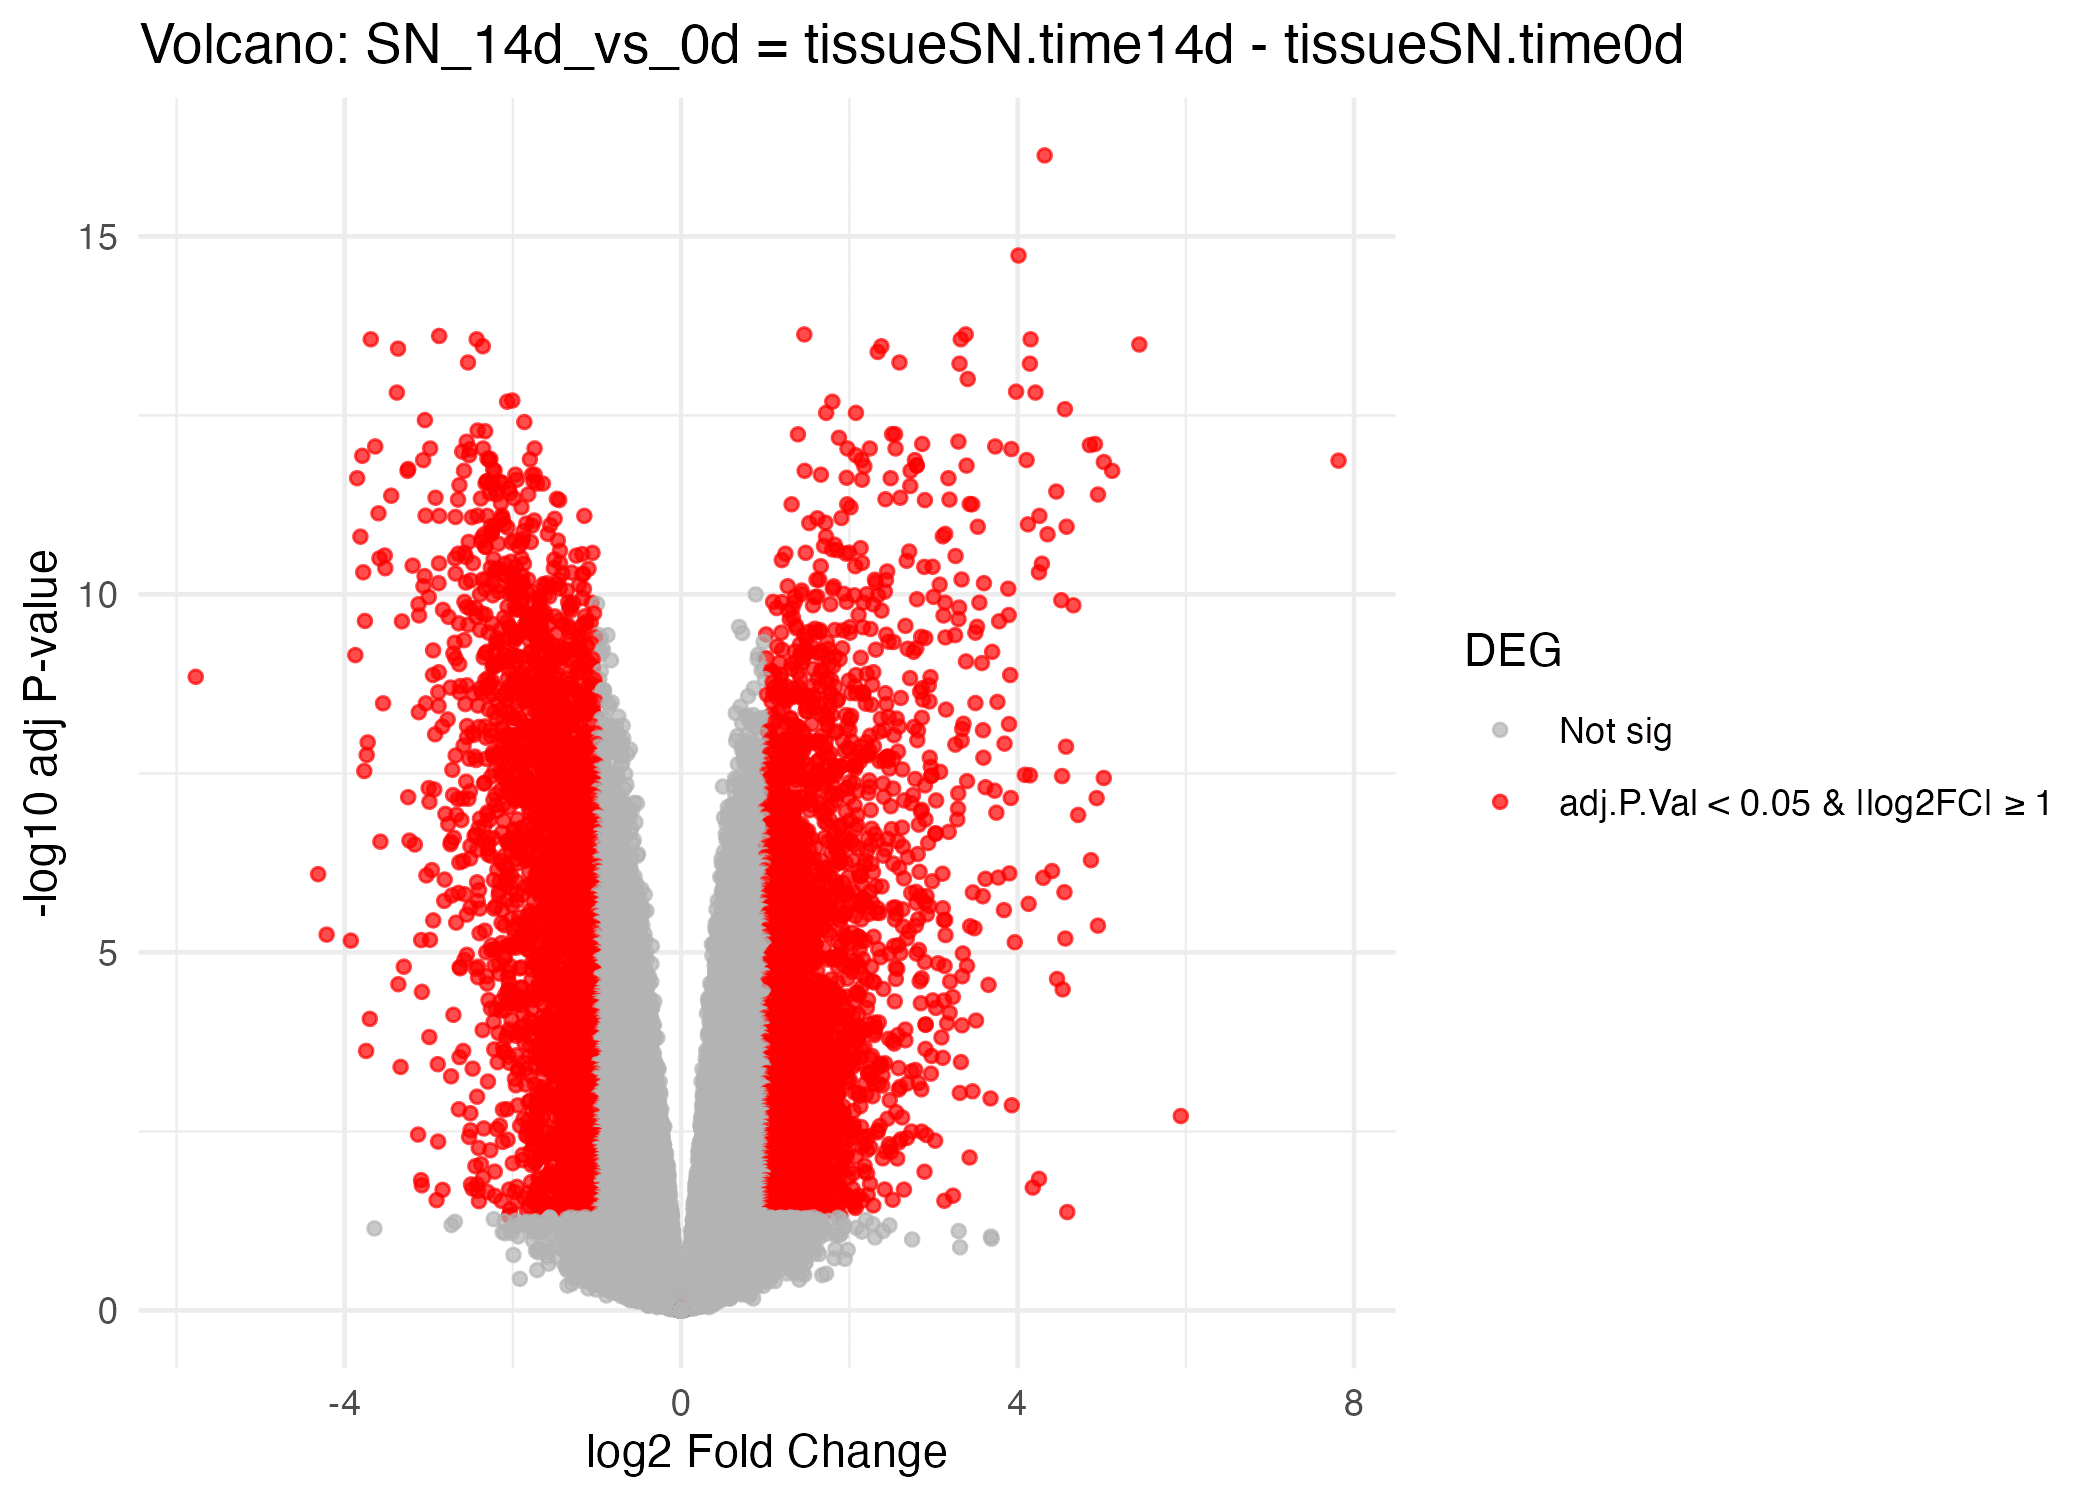
Looking at the data from the late response 14-days (14D) SN continue to show immune response, indicating sustained activation of inflammatory and regenerative signaling (Fig. 4A–B).

DRG are displaying results very close to baseline levels. Most neuronal activation is likely to have ended.

It is shown from these data that DRG response is early and fast, ending quickly. SN response is delayed in response but upregulates for a longer amount of time.

Clustering and Pathway Enrichment

Figure 5A: Cluster Trajectories (C1–C6)
Cluster trajectories showing six gene expression patterns (C1–C6) across 0, 1, 4, 7, and 14 days. Clusters 4 and 5 rise at later timepoints, indicating delayed immune activation.
Temporal expression trajectories (C1–C6) illustrating early neuronal activation (C1–C2) and late immune activation (C4–C5) over 14 days.
Figure 5B: KEGG Enrichment — Cluster 4
KEGG enrichment analysis for Cluster 4 highlighting cytokine-cytokine receptor interaction, T cell receptor signaling, and natural killer cell-mediated cytotoxicity pathways.
Cluster 4 shows enrichment in immune-related KEGG pathways, including cytokine-cytokine receptor interaction and T cell signaling, consistent with late-stage immune activation.
Figure 5C: KEGG Enrichment — Cluster 5
KEGG enrichment analysis for Cluster 5 showing cytokine-cytokine receptor interaction, IL-17 signaling, and other immune-related pathways.
Cluster 5 reinforces late immune activation with enrichment in cytokine-cytokine receptor interaction, IL-17 signaling, and other inflammatory pathways.

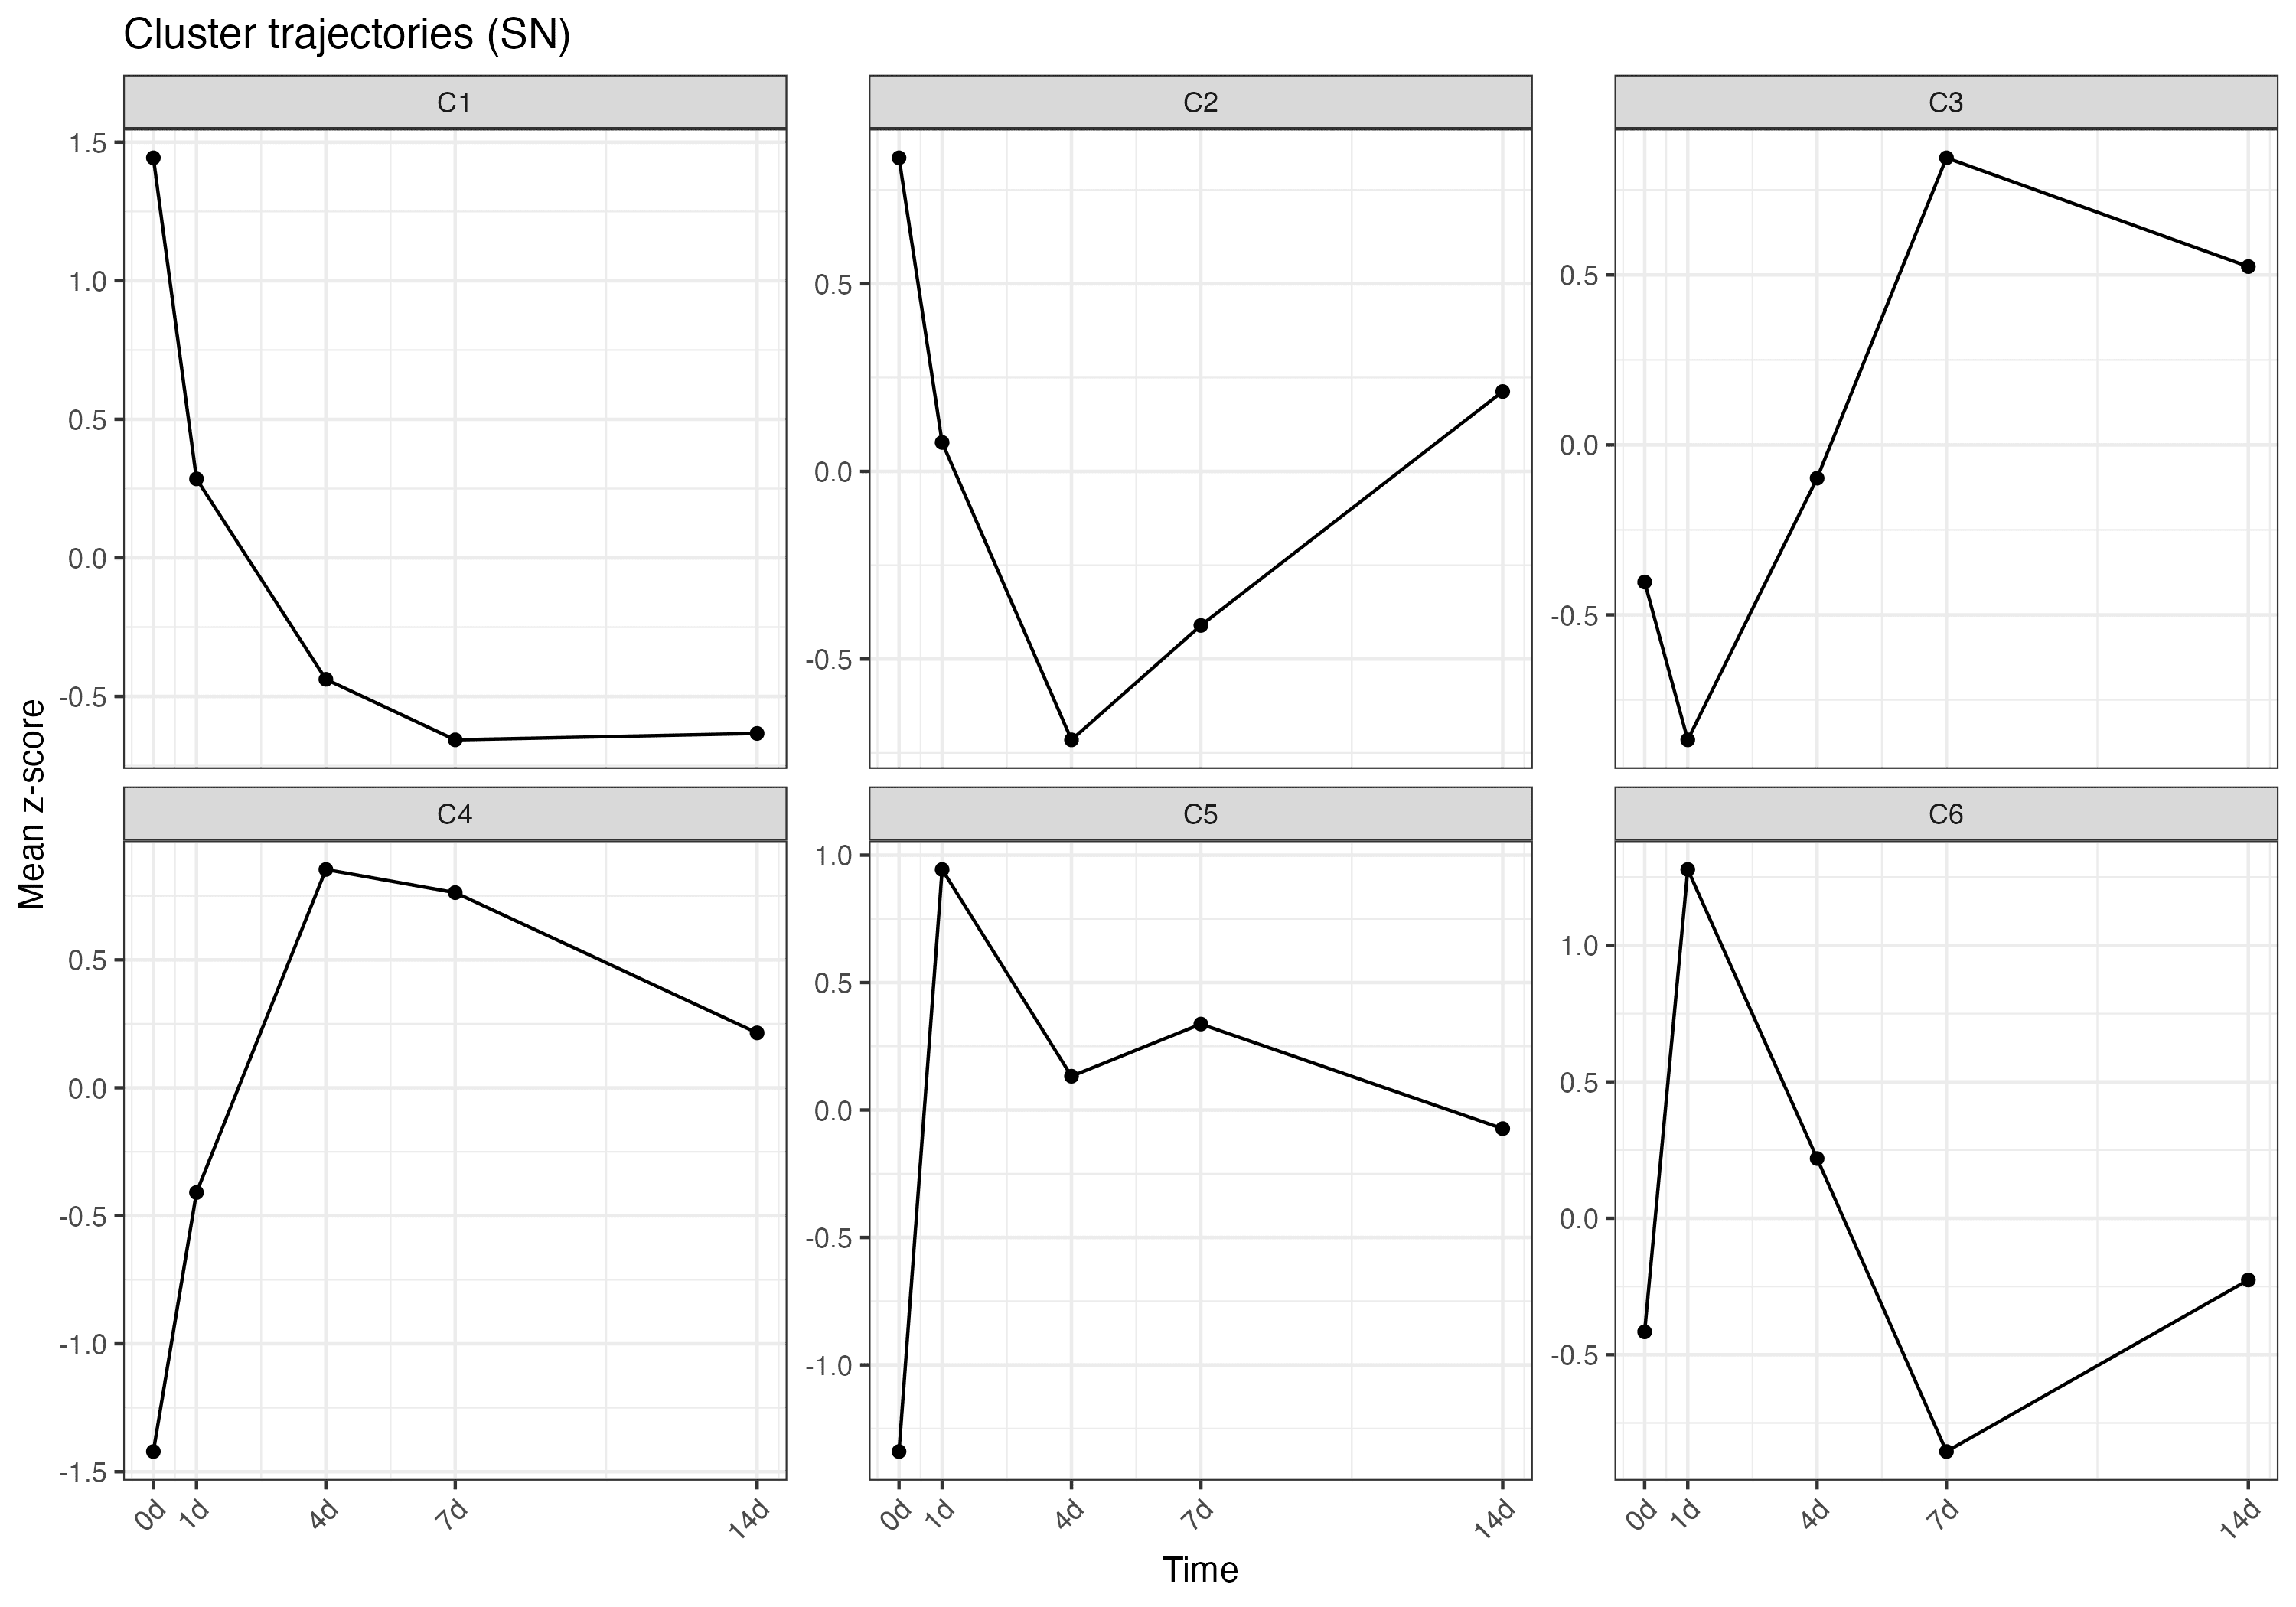
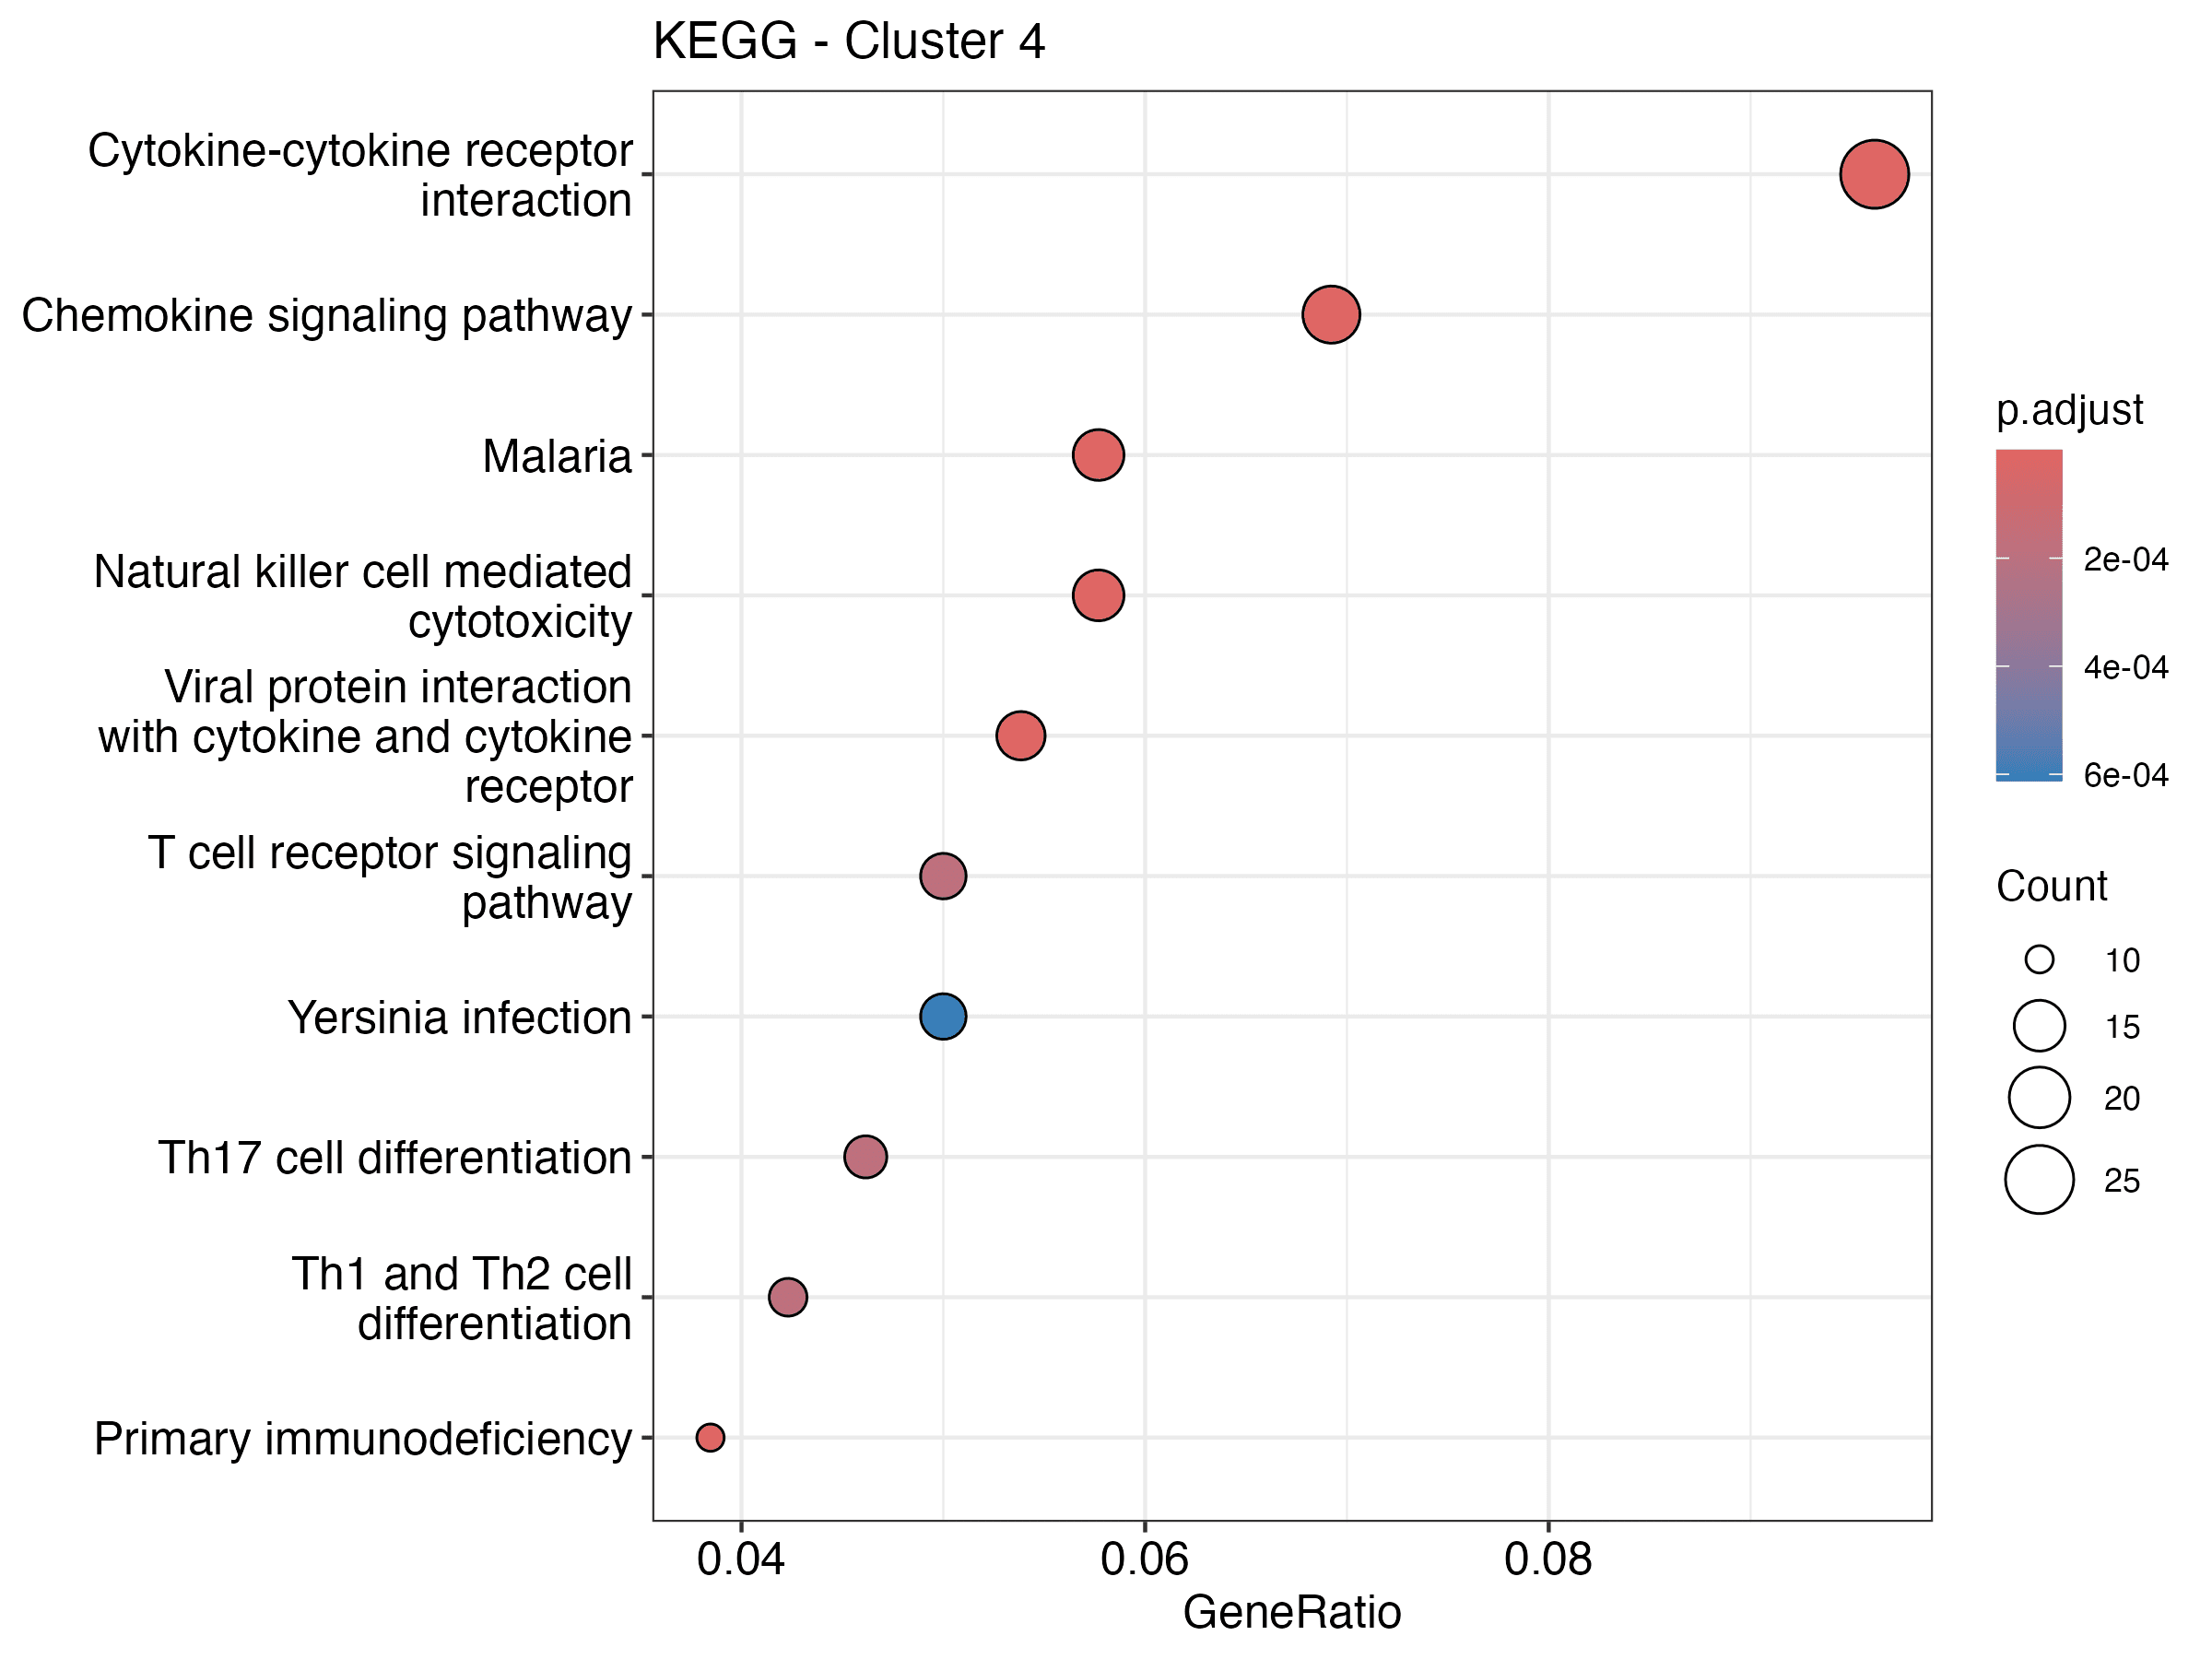
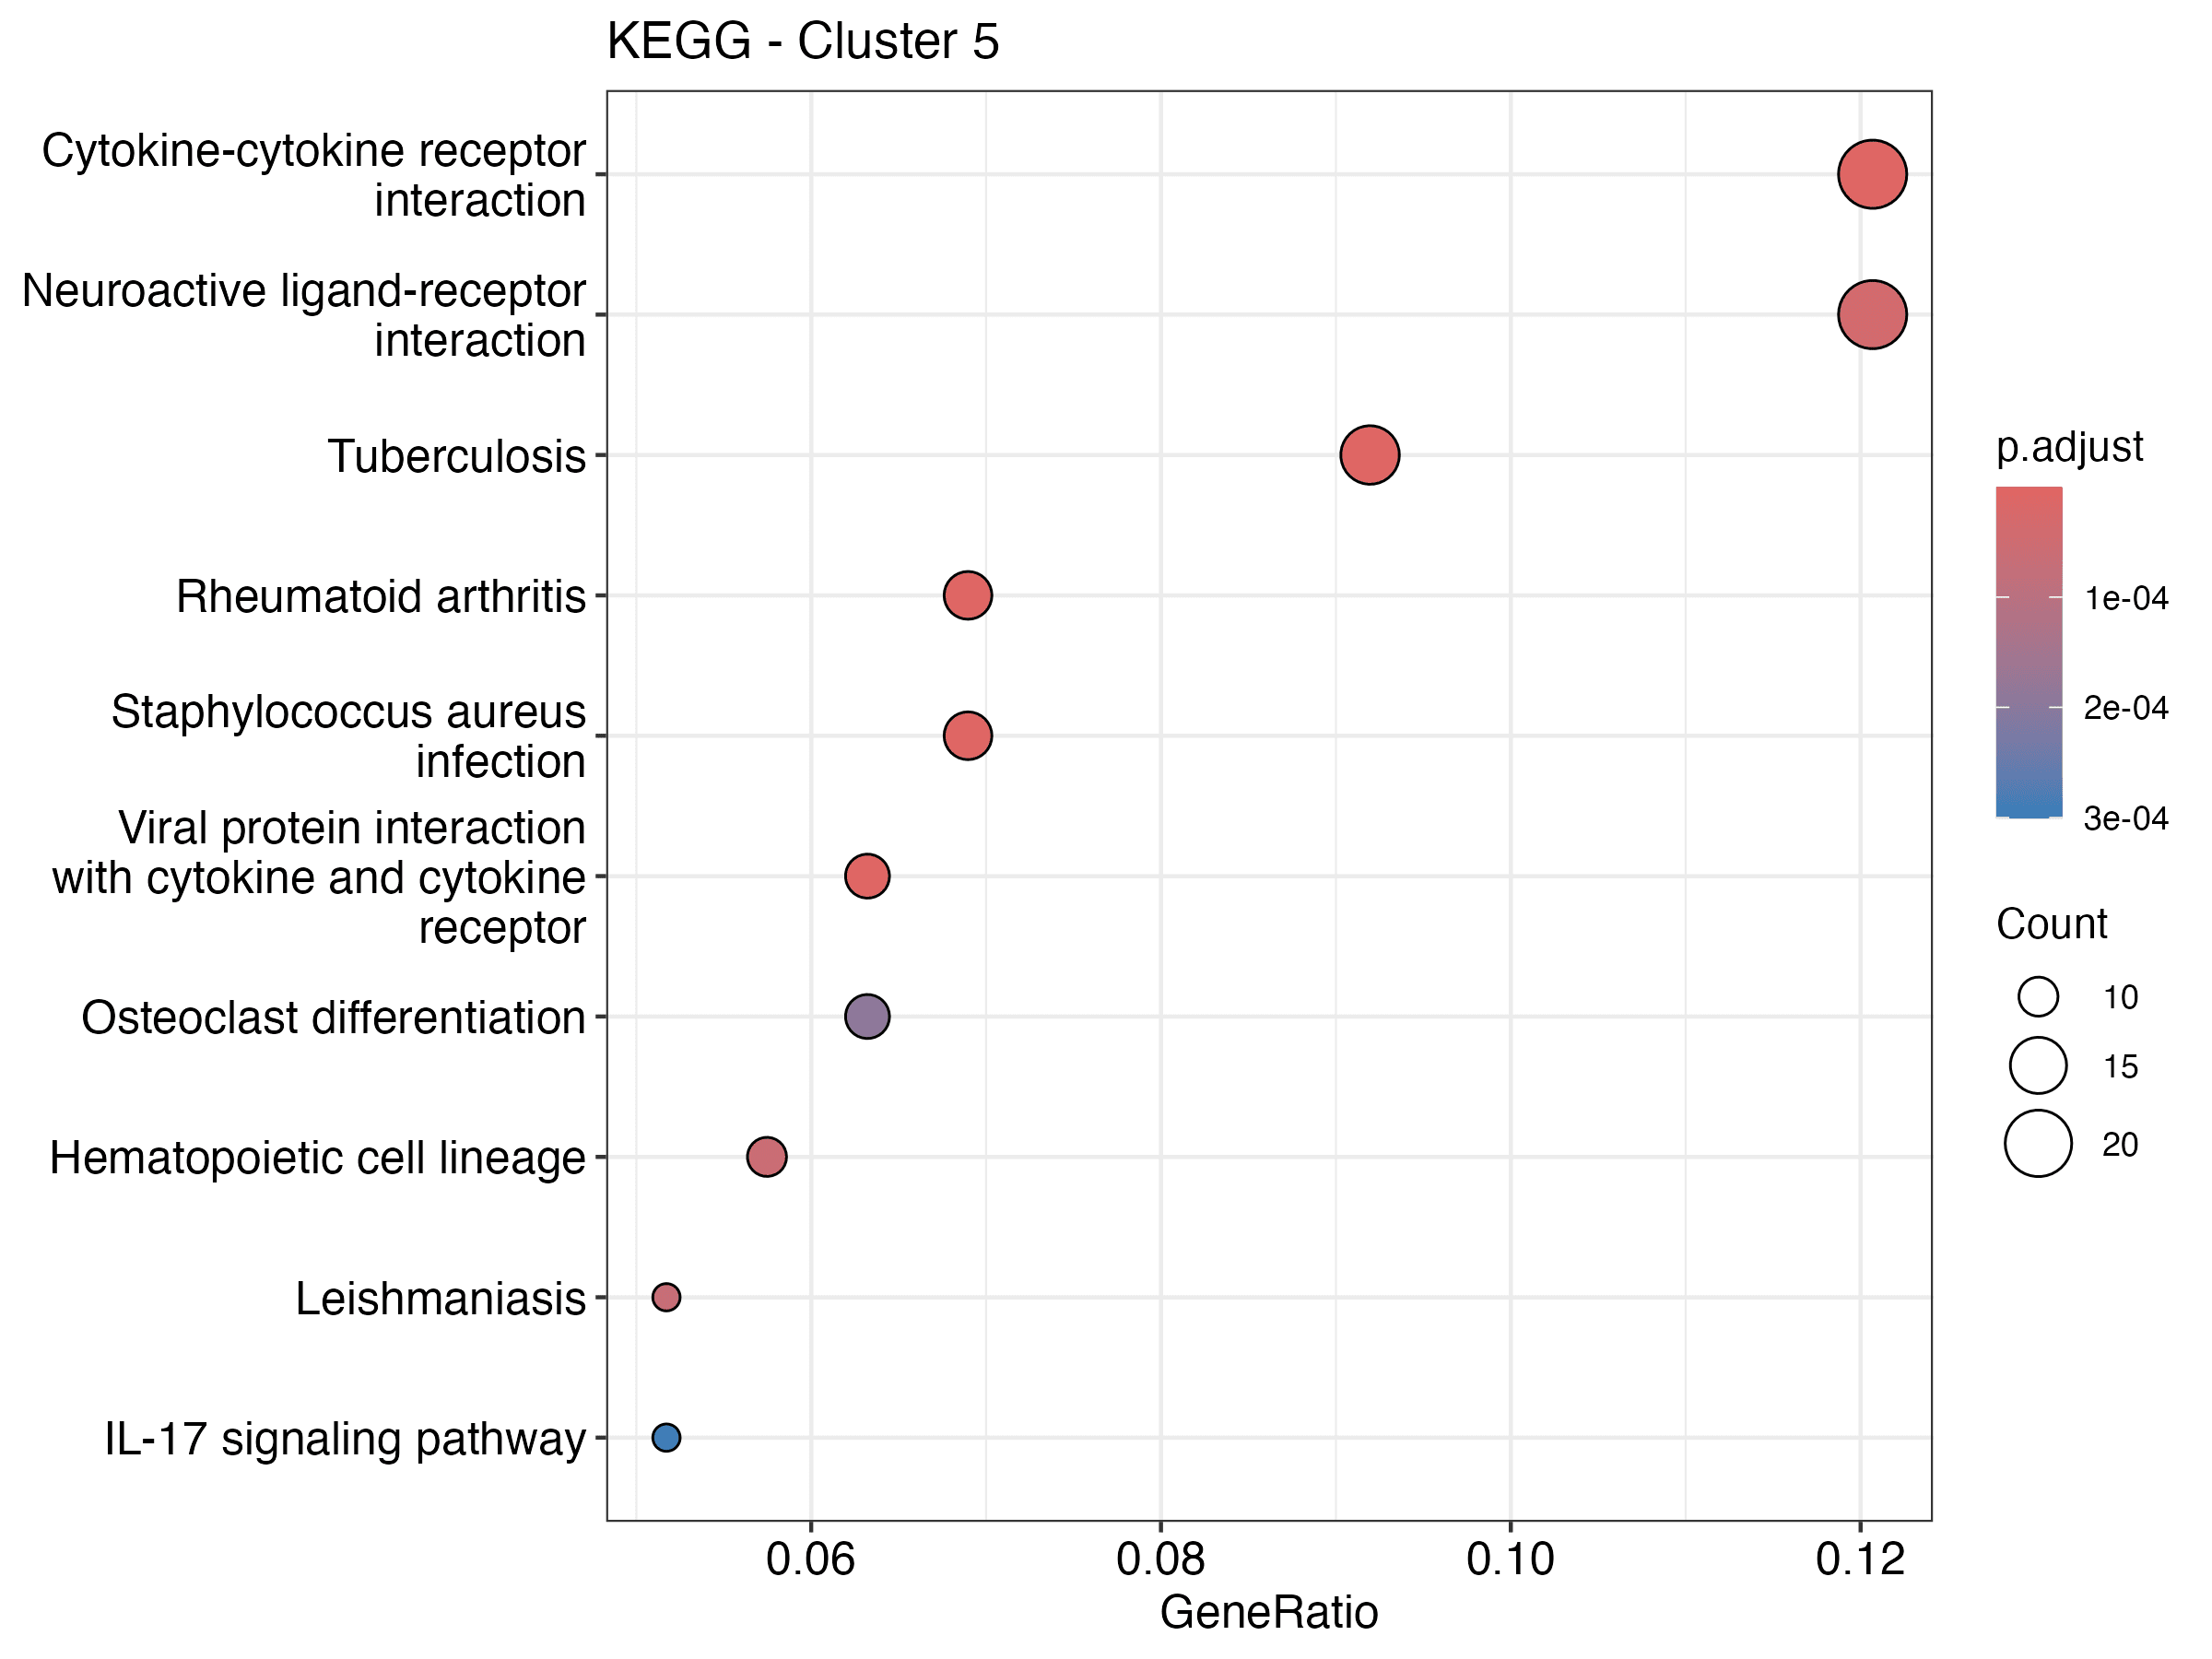
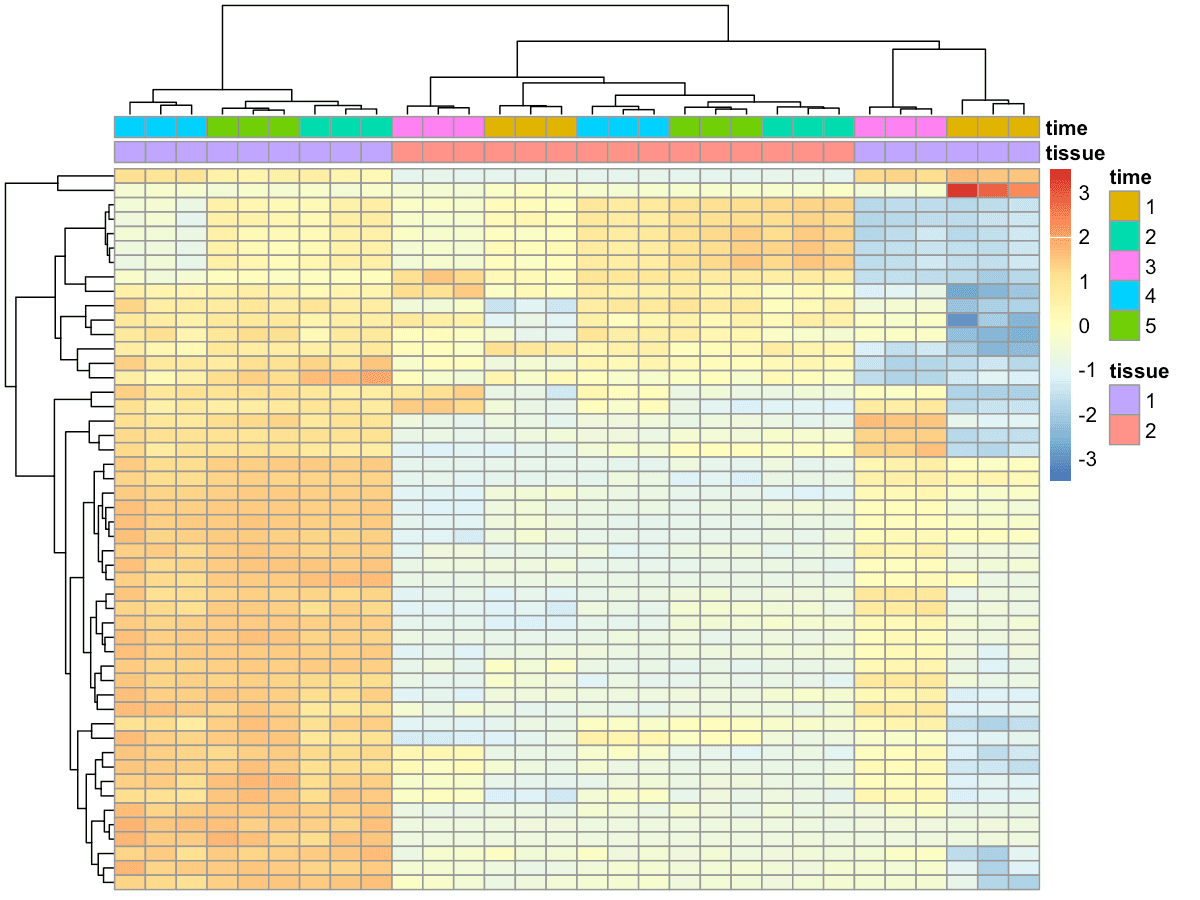
Genes were grouped into clusters which allowed the trajectories to be visualized during the healing process. Looking at Clusters 4 and 5 above (Fig. 5A-C) there is a strong upregulation in days 7-14 with cytokine-cytokine receptors pathways being the strongest.

Conclusion

Peripheral nerves are healed via two separate pathways. The first being early neuronal activation that primarily is seen within DRG at the early timepoints such as 1D. The secondary pathway seems to initiate a few days later having displayed at the 4D timepoint. The latter showcasing cytokine-driven immune and regenerative activity.